> For the complete documentation index, see [llms.txt](https://docs.getdot.ai/llms.txt). Markdown versions of documentation pages are available by appending `.md` to page URLs; this page is available as [Markdown](https://docs.getdot.ai/using-dot/apps.md).

# Build apps

A chat answer is a snapshot in time. A Dot **app** turns that analysis into a **living data product**: you ask for it in plain English, Dot builds it, and it stays connected to your data — fast, interactive, shareable, and traceable to the source.

Apps sit between hand-configuring a BI dashboard and coding one from scratch. You describe what you want; Dot writes the queries, compiles them to real SQL once, and pins the result. Every view then re-runs the real query against live data — **no AI in the render path**, so it's fast and deterministic — while everything stays editable in plain English.

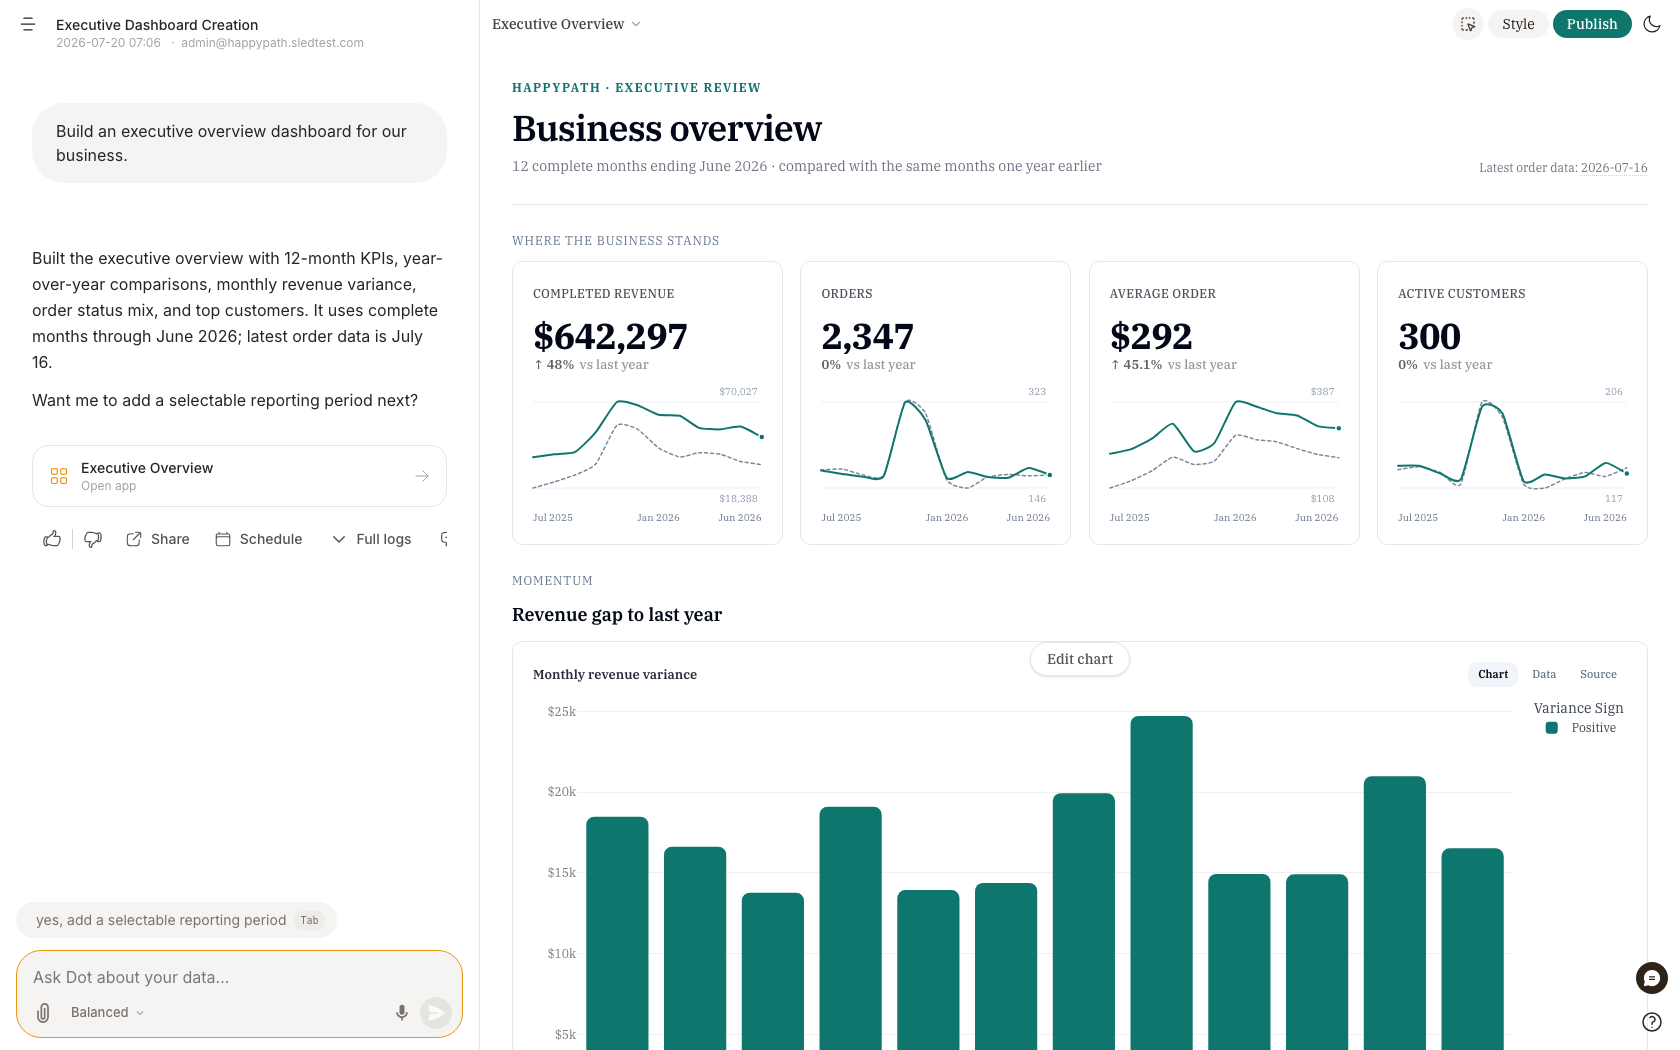
<figure><img src="/files/rfALLwXV9X8X3RNhuEZ8" alt="Asking Dot to build an executive overview dashboard, with the live app rendered alongside the chat"><figcaption><p>Ask in plain English → Dot builds the app → publish, share, schedule.</p></figcaption></figure>

## What you can build

Apps are one format with several modes — **dashboards are just the most common one**:

* **Dashboards** — track KPIs and trends: filterable grids of metrics, charts, and tables.
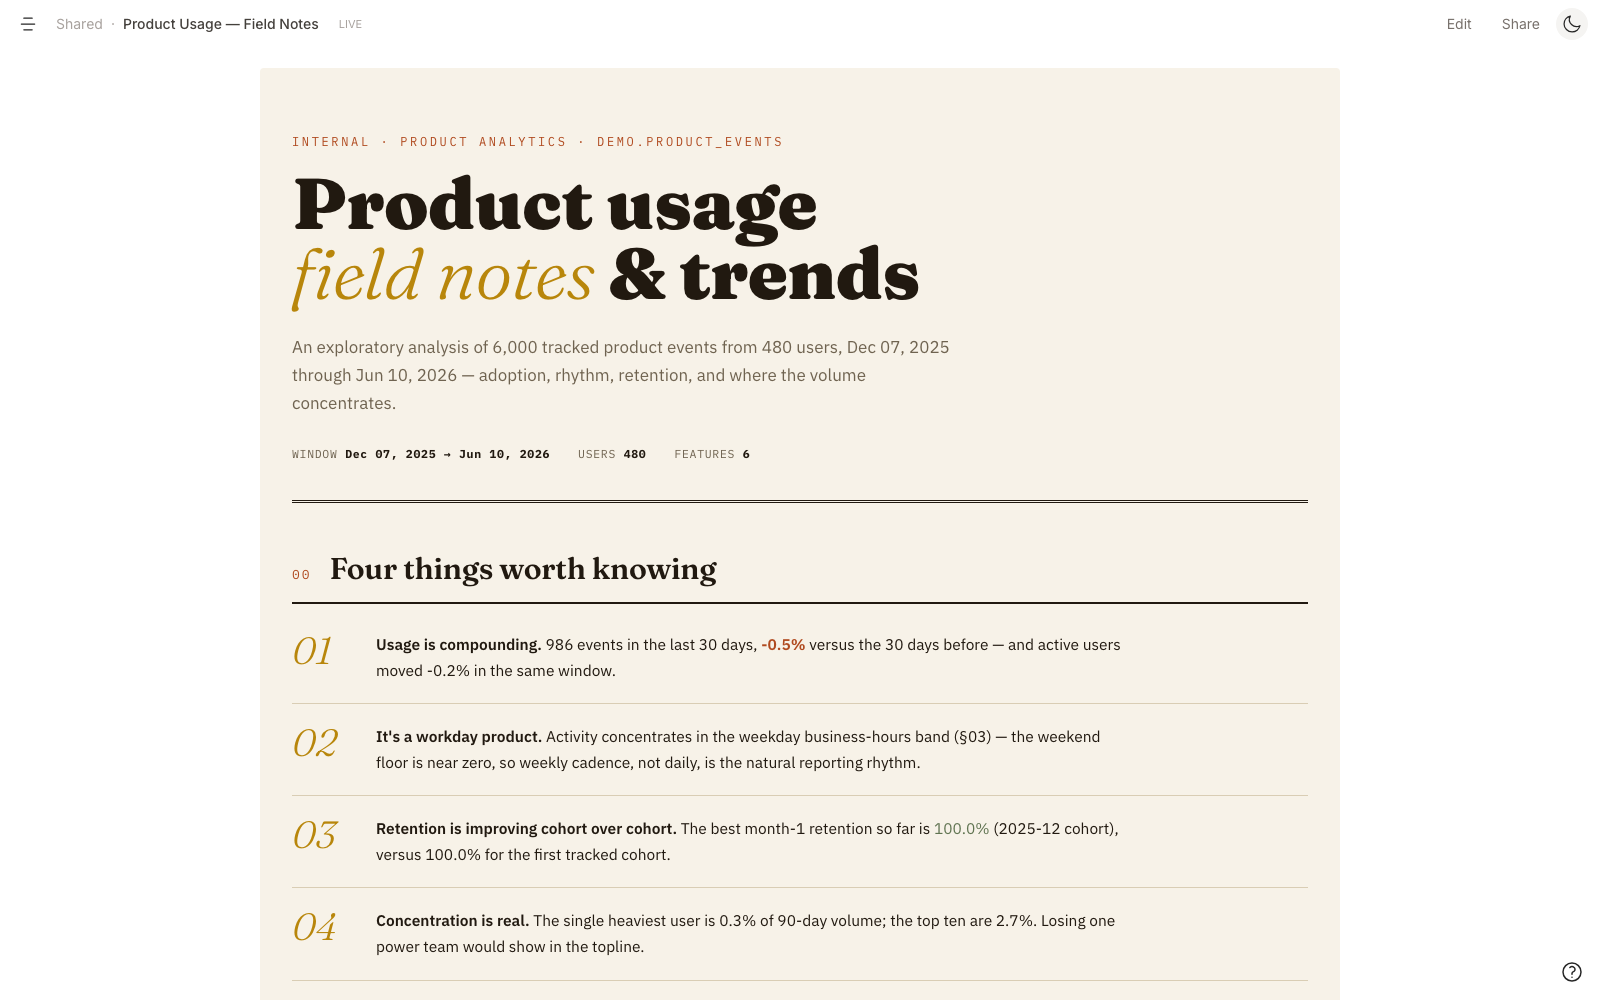
* **Reports** — written, editorial analyses ("state of the business", post-mortems, field notes) where every number is cited.
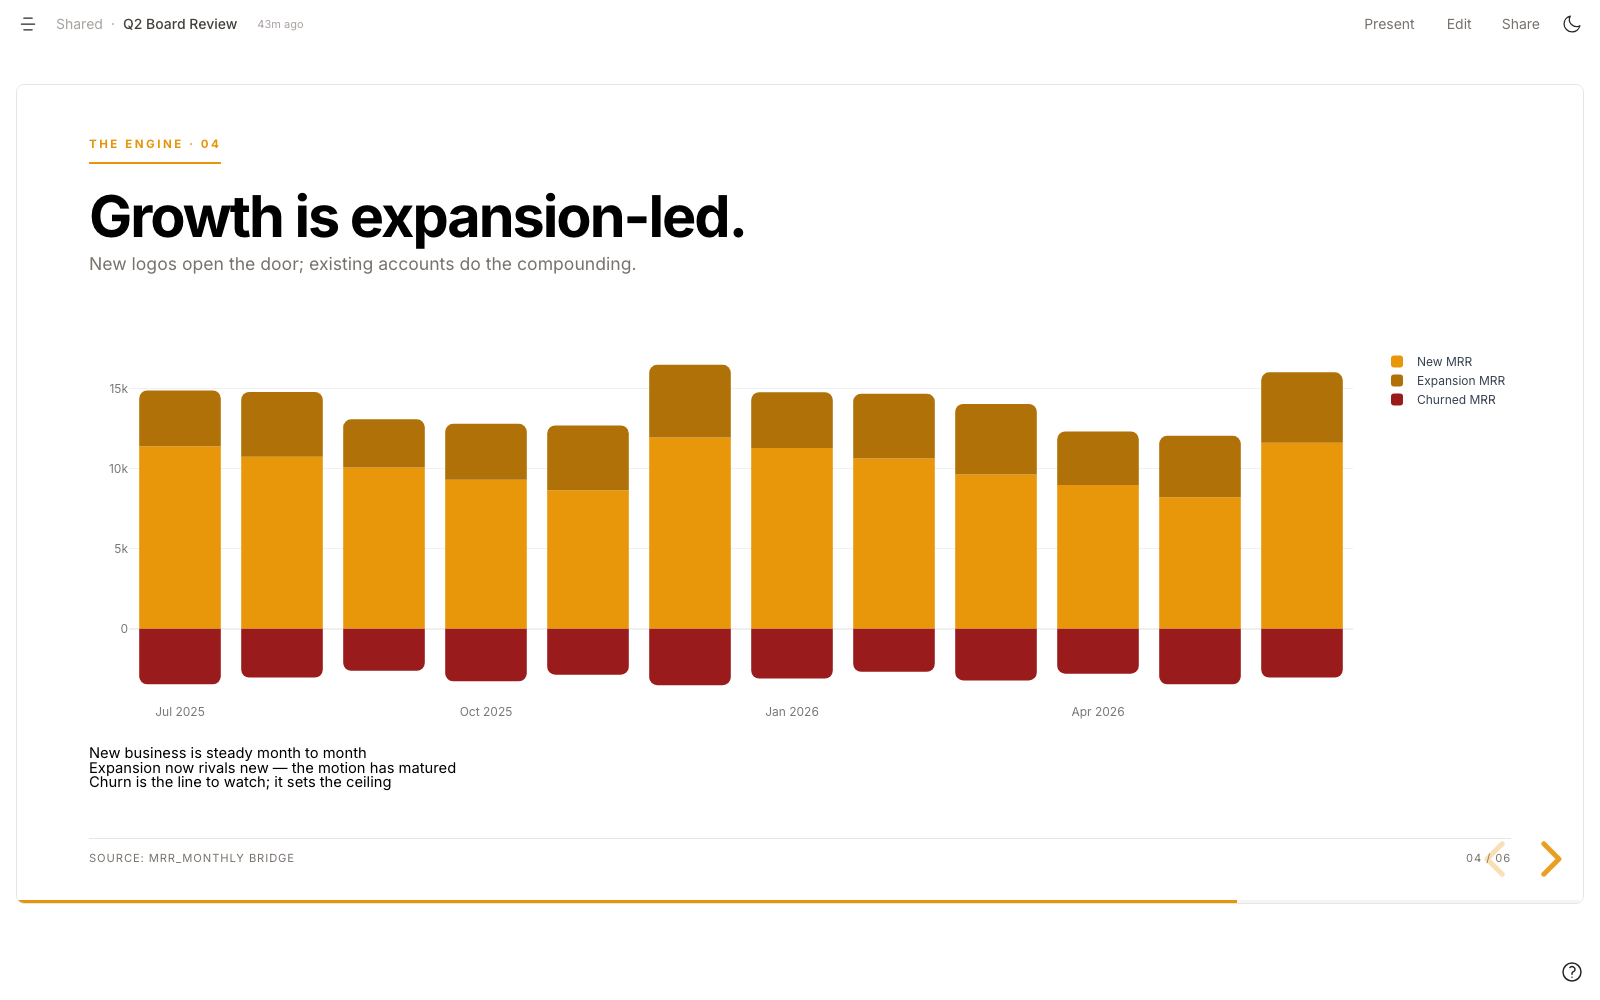
* **Presentations** — live web slide decks for a QBR or board review, with a **Present** button.
* **Data essays** — scrollytelling narratives where a single graphic evolves as you scroll.

They all share the same engine, primitives, and data connections — the difference is a layout choice, not a different tool.

<figure><img src="/files/tvRlDlQnF458gGE7PWlN" alt="An editorial data report titled Product usage field notes and trends"><figcaption><p>A <strong>report</strong> — the same data, as a written, cited analysis.</p></figcaption></figure>

<figure><img src="/files/wtGQwMHcAp6mKOII9ZQS" alt="A board-review presentation slide titled Growth is expansion-led, with a monthly MRR bridge chart"><figcaption><p>A <strong>presentation</strong> — a live board deck you can present full-screen.</p></figcaption></figure>

## How you make one

1. **Ask in chat** — "build an executive overview dashboard", "turn this into a board deck". (Or click **New App**.)
2. **Dot builds it** — it compiles your plain-English questions to SQL, dry-runs them, and shows a live preview with an **Open app** card.
3. **Refine conversationally** — "add a region filter", "make it a report", "change the theme". Every edit rebuilds and re-previews.
4. **Publish** — the app appears on your **Apps** page, either personal or shared with the workspace.

## Live, interactive, and yours to edit

* **Always current** — every view runs the pinned SQL against live data. Refresh on demand or on a [schedule](/using-dot/scheduling.md).
* **Interactive** — a declarative filter threads through every card whose data has that column and cross-filters the rest automatically; view controls (log/linear, time window, smoothing, show/hide series) flip instantly, client-side, with no re-query. Your filter choices go into the address bar, so copying the URL shares the exact view you are looking at.
* **Editable** — AI-built, but fully human-editable: the text, layout, style, and the queries themselves — in chat or by hand.

## Share it anywhere

* **Share link** — a private link you can revoke at any time.
* **Embed** — drop an app into your wiki, portal, or product.
* **PDF** — a board-ready export that still links back to the live app. It exports the view you are looking at, so the filters you picked are the ones in the file, and the link inside it reopens that same filtered view.
* **Present** — full-screen live slides straight from the browser.

## Trust and governance

* **Every number traces to its source.** Click any value to open the exact query and its compiled SQL; each card carries a **Source** pill, and the data-lineage view maps an app back through its queries, tables, dbt models, and sources.
* **Certification.** An admin or modeler can mark an app **Certified** — and the badge drops automatically if the underlying source changes without re-review, so a trust signal never goes stale silently.
* **Permissions & usage.** Folder-based view/edit control, per-app view counts, and auto-archiving of apps no one opens anymore.

## Apps as code

For teams who review changes like software, every app is a plain `.app` file you can version-control. Pull and edit it locally, push to recompile the SQL, and open a pull request — with model changes branched and merged through environments.

See [CLI & AI Agent Skill](/developers/cli.md) for `dot apps` and `dot env`, and [GitHub Sync](/train-dot/version-control/github.md) for keeping apps in your repo.

{% hint style="info" %}
"Dashboard" is one kind of app. The feature grew from dashboards → reports → **apps**, which is now the umbrella for all of them.
{% endhint %}